Intro
Usually SAPUI5 project life cycle includes different phases, starting from specifications and going through ODATA and UI development.As projects evolve, question of usage and analytics will arise:
- How many users do we have in our SAPUI5 application?
- How often do they log on and use the solution?
- What are the ODATA entities used during application usage?
- How often do users perform create & update ODATA operations?
- Which entities were created through the SAPUI5 application?
In this short blog I will try to cover general SAP NetWeaver Gateway tools that allow us analyzing the usage & efficiency of our custom SAPUI5 developments & standard Fiori apps.
Detailed metering data
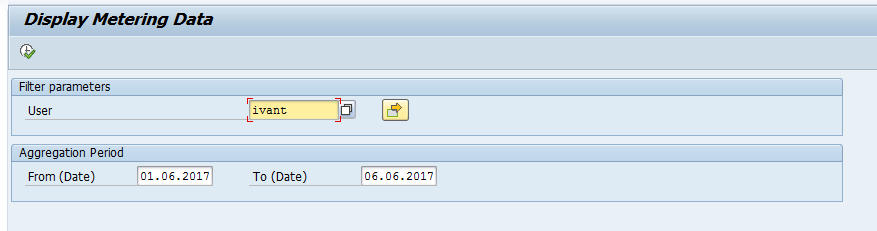
By executing report /IWFND/R_METERING_VIEW through SE38 you will be able to get all ODATA calls information by user & date range.
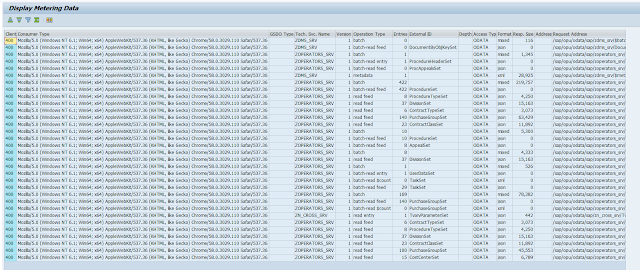
You can use embedded filters & sorting to try and analyze the data, in case you need to get your hands on the actual data - you can access it by going to table /IWFND/L_MET_DAT

You can use embedded filters & sorting to try and analyze the data, in case you need to get your hands on the actual data - you can access it by going to table /IWFND/L_MET_DAT
Aggregated data
Table /IWFND/D_MET_AGR will show you 2 important metrics:
- Usage per CRUD call (create / read / update / delete)
- Number of active users per month

Table /IWFND/L_METAGR will show you aggregated data on service / month level


Application log
You can also use the application log to see errors & execution times in case you wish to analyze errors / loads of your ODATA services by launching SAP Gateway Application Log Viewer through transaction /n/IWFND/APPS_LOGError log
All failed ODATA requests are written into error log, which is available through transaction /IWFND/ERROR_LOGJobs behind the scene
Once you activate the SAP NetWeaver Gateway you are automatically scheduling 2 standard jobs:
- SAP_IWFND_METERING_AGG
This job is scheduled daily and updates the aggregation summaries - SAP_IWFND_METERING_DEL
This job is also scheduled daily, it cleans up aggregation data older than 2.5 years back, and also cleans up the data from /IWFND/L_MET_DAT on monthly level.
In case you execute the report /IWFND/R_METERING_VIEW by 1st of the month you are going to see 0 entries, so it might be a good idea to cancel this job scheduling to collect your data.